
Checking Notes from Nature Data
You may have wondered how we will use the data you are transcribing… Especially after you spend a few minutes trying to figure out the meaning of some unclear handwriting, and are uncertain whether the year on the label actually says “1976” or “1879,” or if the locality is “Vino” or “Vina” in California.
The first step in using Notes from Nature transcription data in research is checking data quality. Each specimen is transcribed independently by four different users, so mistakes in a single transcription do not impact the accuracy of our data very much. But how do we determine the right one out of the multiple transcriptions? For controlled fields such as country and state, this is simple: we perform a “vote-counting” procedure, where the value with the most “votes” is considered correct. However, this is much more difficult for open-ended fields such as locality or collector names.
One of the early approaches was to quantify differences between transcriptions. We did this by using the Levenshtein edit distance, named for the Russian information scientist, Vladimir Levenshtein, who developed a way to quantify the minimum number of single-character edits required to change one string of text to another. For example, “12 mi W Oakland” and “12 mi. W Oakland” would have a score of 1 because of the period after “mi”. We then looked for highly similar pairs of transcriptions for each specimen (pairs that were separated by the smallest edit distance), and then chose one of the pair. Our assumption was that if two separate transcriptions are almost identical to one another then either one must be very close to being correct. However, this assumption becomes violated if users are consistently wrong (either because the label is partially obscured, or the handwriting difficult to read, etc.). Furthermore, this was not a true consensus in the sense that our algorithm only decides which transcription out of the four is the best.
During the Hackathon last month (discussed in an earlier blog), it was quickly obvious that this approach was not ideal. In discussions with other researchers and experts, we developed an approach to combine the best elements of each individual transcription into a locality string that was greater than the sum of its parts. We did this using a concept from bioinformatics known as “sequence alignment.”
Genetics researchers and molecular ecologists use sequence alignment to match up multiple DNA or amino acid sequences in studies of evolutionary history or DNA mutation. To evaluate alignment, algorithms look for particular strings of amino acids or nucleotides within multiple sequences, and match similar or identical regions. Even closely related sequences, however, are often not identical and have small differences due to substitutions, deletions or insertions. So, alignment algorithms use complicated scoring mechanisms to generate alignments requiring as little “arrangement” as possible. The goal is to balance potential insertions, deletions and substitutions in characters from one sequence to the next.
In Notes from Nature data assessment, we use this method and assume that differences between transcriptions in a particular location may be due to substitutions. Or, we introduce gaps so that two separate chunks of sequence might be better aligned. This is especially useful if there are certain chunks of text within an individual transcription that are not consistently shared among all other transcriptions.
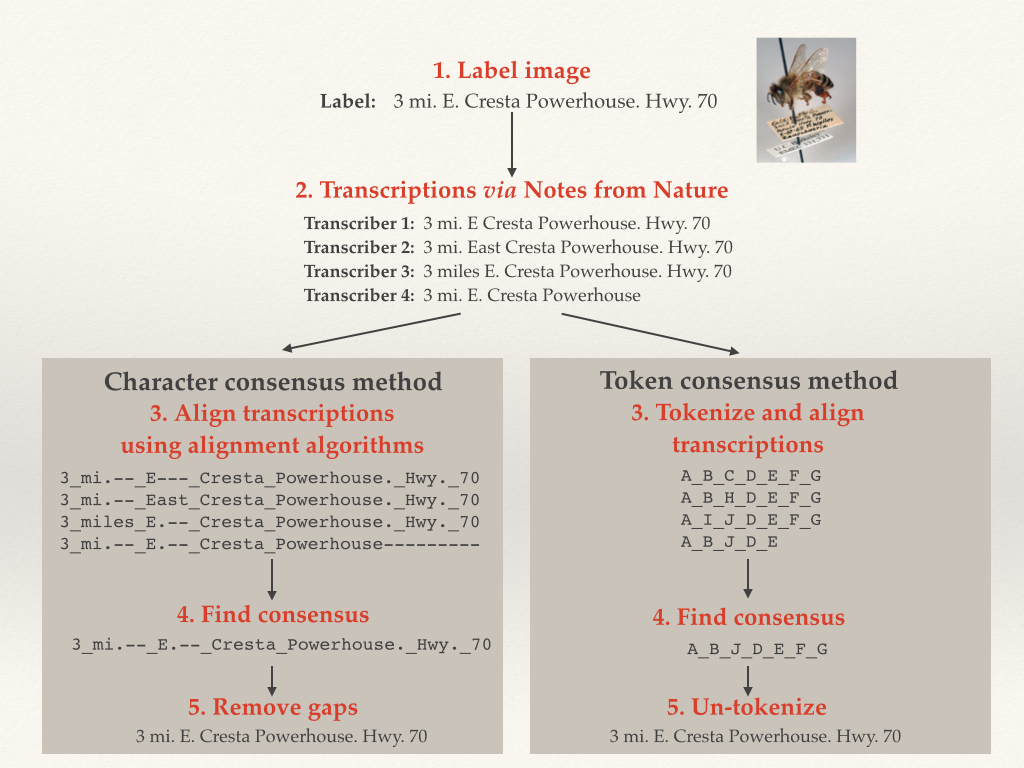
We implemented sequence alignment in two ways, using token and character alignment. For token alignment, we converted each chunk of text (usually individual words) and assigned each unique chunk a “token.” We then aligned the tokens. For character alignment, we compared each character in the text string directly. This proved to be the better method, as we inherently had a lot more information for the alignment software to work on.
An Illustration of Character and Token Alignment
To compare how well our algorithm was doing, we manually transcribed around 200 of Calbug’s specimens, and ran our algorithm on user transcriptions. 70% of the consensus transcriptions were either EXACTLY identical or within 5 edits to our manual transcriptions. While this result is preliminary and we’re still working on improvements, it is worth mentioning that the testing data set included quite a lot of the very worst examples of handwriting on a teeny tiny label.
Proportion of records that were exactly identical or within 5 edits to manual transcriptions
| Method |
Field |
Proportion exact (n =158) |
Proportion < 5 edits |
| Token |
Collector |
37.3 |
74.1 |
| Token |
Locality |
38.6 |
58.8 |
| Character |
Collector |
38.0 |
88.0 |
| Character |
Locality |
37.3 |
69.6 |
Proportion of specimens that were a certain edit distance away from our manually-transcribed set of specimens
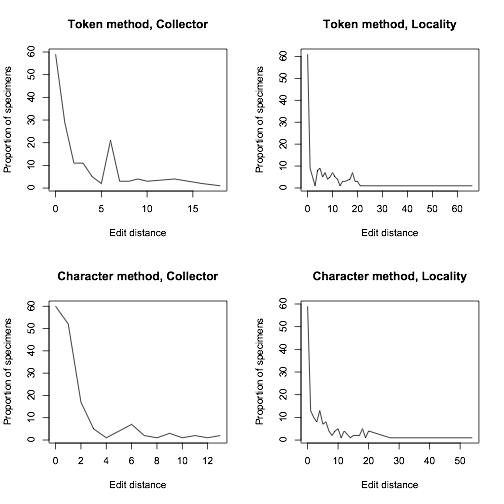
In closing, we’d like to emphasize the importance of typing exactly what you see in the open-ended fields for collector and locality. A certain degree of interpretation may be necessary. For example, if there are no apparent spaces between words (e.g. DeathCanyonValley) it would be useful to add them. But, it is often very difficult (probably impossible) to derive a consensus if the inconsistency of label data is compounded by inconsistencies in data entry. We have ways of dealing with the huge diversity of abbreviations, so it would be helpful if you enter them as they are when you see them with minimal interpretation. The overall lesson from our data quality comparisons is that so far we are doing great, thanks to your careful work!
Want to learn more? Check out a related blog post, here.
—
By Junying Lim

Trackbacks / Pingbacks