
Fungus Among Us
Fungus Among Us considers the 19th-Century fungi collected in South Carolina by Henry William Ravenel
It’s not ‘your-celia’, it’s mycelia. Fungus Among Us asks volunteers to consider the myriad of mycelia that invade the earth, leaves, tree-bark and other substrates in their backyards. That’s exactly what Henry William Ravenel did back in the late 1840’s – except his backyard was either the malarial swamps of the lower Santee River or the diverse set of habitats found in and around Aiken, South Carolina. His exhaustive work culminated in the publication of the Fungi Caroliniani Exsiccati published between 1852-1856. The work consisted of five bound volumes called ‘Centuries’. Each Century contains 100 specimens of dried fungi that were painstakingly glued to the pages along with a descriptive label. In all, 30 copies of the five Centuries were produced for a grand total of 15,000 individual specimens that were carefully selected by Ravenel. Recognizing that his work was the first major effort to document the Fungi of North America since Lewis David von Schweinitz (1780-1834), Ravenel sent a copy to the Smithsonian Institution. Later that copy formed the nucleus of what is now the National Fungus Collection. The specimens presented here are from a copy that Ravenel presented to his Alma Mater – South Carolina College (now the University of South Carolina).
We encourage professionals, students, and citizen scientists from a variety of backgrounds (history, botany, mycology, etc.) to explore the world of 19th-Century Mycology and to help us by entering the label data visible on the image for each specimen. There is an interesting twist to this new expedition. Ravenel write his habitat information in latin. We don’t expect you to translate this text into to english, but some might find it interesting to research the meanings. Have FUN transcribing for . Among Us! Your hard work will eventually be displayed on the Mycology Collections data Portal, and will help update the entry for the Fungi Caroliniani Exsiccati.
To learn more about Henry William Ravenel and his contributions to science during the 19th Century please visit Plants & Planter.
So What Do We Do with All of Your Transcriptions?
We wanted to explain more about what happens behind the scenes after our awesome Notes from Nature volunteers do transcriptions or classifications. What do we do with it and how do we get it back to curators or other scientists at Museums? One thing you may not know is that every label is transcribed by three different people. The idea is that more folks examining labels will lead to better results. For example, if two people enter Wisconsin for the state, and one person accidentally enters Wyoming then we can assume Wisconsin is correct and that Wyoming was a mistake. We also know that some labels are tough to interpret, and sometimes a couple different guesses can get closer to the right answer than just one.
This seems pretty easy right? Well… it gets more complicated when we start working with free text labels. Those text boxes where you enter sentences and phrases from the label. Things like locality information “Route 46 next to a tree by the stop sign on 4th street”, or habitat data “in a field”. How do we compare answers for these kinds of labels. What do we do with extra punctuations? Extra spaces? Extra words? Different words?
We have spent the last few months writing code that helps handle these kinds of situations. Essentially we want to first find labels that match and if not then we want to select the best label we can from the set of answers. We have set up a series of decisions rules to go through your answers. First, we ask if two of the three answers are identical including spaces and punctuation. If they match we are done. If not, then we remove extra spaces and punctuation and ignore capitals and ask if two of the three answers are identical. If so then we select the one with the most characters- with the idea of getting more information.
These two labels would be found to match after removing punctuation, spaces and ignoring capitals. Here we generally take the one with more characters to include as much information as possible.
Rd. 10 KM 24
*RD. 10. KM 24
*this one gets selected more characters
At this next stage things get a little more complicated and we want to use our decision rules to select the best answer we can among the three. First we look for labels where all of the words from one are found in another – partial ratio match. If we find this then we take the label with the most words.
North Fork of Salmon River at Deep Creek, by US-93
*North Fork of the Salmon River at Deep Creek, by US-93
*partial match selection– more words
Finally, we compare the answers using both a ‘fuzzy matching’ scheme. The fuzzy matching looks partial matches on words for example someone may have written ‘rd’ whereas someone else wrote ‘road’, our fuzzy matching will allow those to be considered the same. This strategy also allows for slight misspellings between words. If we get a fuzzy match between the two labels then we take the label with the most words. That ensures that we get the most data we can from these answers.
*County Line Road 2 mi E of airport
County Line Rd. 2 mi. E. of airport
*fuzzy match select this one
The end result of all this is a reconciliation “toolkit”. We pass all transcripts from finished expeditions through this toolkit, and it delivers three products. The first is just the raw data. The second is a best guess transcription based on the field by field reconciliations described above. The third is perhaps the most important – a summary of what we did and how we did it as a .html file. The summary output is something we are extending, as we think of new things that providers might want to see. Here is an example from the New World Swallowtail Expedition, one of the more difficult expeditions we’ve launched.

More recently, we have added some new features, including information about how many transcriptions were done by transcribers (based on their login names at Zooniverse) and a plot of transcription “effort” and how that looks over all transcribers. The effort plot is very new, but we wanted to provide information on whether most of the effort is done by a very few people, or there is more even spread across transcribers. Here is an example for a different expedition, “WeDigFLPlants’ Laurels of Florida”:

Finally, we give them the information about how labels were reconciled (if there was an exact match, partial or fuzzy match). We do this so the providers can go through them and decide if there are some they want to check. We also highlight any problem record, those for which we could not get a match, or those for which there was only one answer – so we could not compare the answers. Here is an example from one label. The areas in green are the three different answers, the top row is the ‘best guess’ reconciled record and the gray row is information about how the reconciliation was done. For example on the first column Country all three answers were Myanmar – and in gray it says we had an exact match with three answers. The ones in red are potential issues (in this case only one answer given).

The goal of all of this is to make it easy for providers to use these data right away. And we’ll note that this tool allows us to also get an overall look at transcription “success” rates, something we may come back to future posts, because these numbers are striking and illustrate the high value of this effort.
– Julie Allen, Notes from Nature data scientist
Three cheers for Visiteers!
Thanks to an awesome group of volunteers who came to visit us at the Natural History Museum London today (Visiteers), the second batch of Chalcid slides in the Magnified section have now been completely classified! Hurray!

Visiteering is one of the ways in which we invite the public to take part in our science at the museum, and today’s stellar group has set an all-time record for number of classifications in one day. Absolutely Awesome.

We’ll try to get the third and final batch of Chalcid slides launched in a new Expedition soon – but in the meantime, a VERY big thank-you to the Notes from Nature community and our Visiteers in the museum for all of your help in setting this data free.
Carabid beetle genome #seqthebeetle
This seemed fitting given our current bombardier beetle expedition. In addition, our very own CalBug data provider and NfN founder member Kip Will is a principal investigator on the project.

Help get a genome for the amazing Bombardier beetle #seqthebeetle
Vote daily from now until 5 April here https://tinyurl.com/gn84mu8
Phenology of Oaks: A recap
A huge shout out to our volunteers for quick work on our first NFN Ideas project, which focused on oak phenology. We completed the expedition a week after launching it, with 1944 transcripts of 644 subjects. 53 awesome transcribers took part. A lot of discussion on talk focused on some of the challenges with denoting flowers and fruits — it is harder than it first looks! So folks were interested in whether there was consistency among transcribers, and if the results would be consistent with an expert assessment. We have some initial answers to those questions and more! And a note that ALL of these data – the label data and phenological scoring – were ALL done by Notes from Nature volunteers.
So to get right to it! Transcriber consistency on this expedition was absolutely remarkable. Well above 99%. Yeah. We were surprised, too. There were three cases where we didn’t get consistent results. Just 3! Out of 664 subjects. So apparently there was very strong agreement.
We took a closer look at the three that seemed to prove difficult.
Those were:
- subject_id: 4308678 –http://www.sernecportal.org/portal/collections/individual/index.php?occid=11108535
- subject_id: 4308659 –http://www.sernecportal.org/portal/collections/individual/index.php?occid=11108069
- subject_id: 4308844 —http://www.sernecportal.org/portal/collections/individual/index.php?occid=11130030
The consensus scoring for those from transcribers were:
- subject_id: 4308678: Flowers: No, Fruits: No
- subject_id: 4308659: Flowers: No, Fruits: Yes
- subject_id: Flowers: Yes, Fruits: No
I then asked NFN’s own Michael Denslow, who is also a darn fine botanist, for his assessment (without reporting anything about transcriber’s scoring), and he was 100% consistent with the three above. He noted for 4308678, “Funky one for sure” and for 4308659, “The terminal buds might be confusing people on these. Based on the collection date (and presence of terminal buds) fruits could be from pervious fall.”
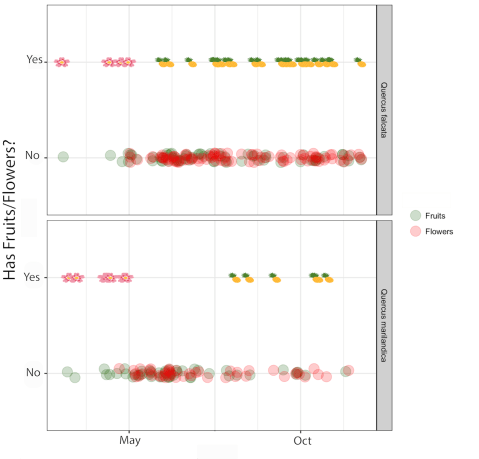
And finally, we wanted to see if we could use these data to look at phenology patterns, so our data scientist Julie Allen did some quick visualizations of the data using the statistical package, R, which has some great plotting functions. You can see our plot above, for two species, Quercus falcata (top) and Quercus marilandica (bottom), two common oaks where we had enough data to examine patterns. The plot shows time on x-axis measured from March through November, and the y-axis is just a yes-no response. For yesses, we show a little emoji, and for no’s you can see those no reports over time for fruits and flowers in different colors. Yup, we decided to go with a tropical flower and fruit motif here, despite oaks definitively not producing pineapples!
The really neat thing is that we do pick up the short, and early flowering period for oaks during Spring, and in Q. falcata, a seemingly quick transition to acorns, and a slower cadence for Q. marilandica (note the longer period between flowering and appearance of acorns). There are still some great questions to examine here — these records were not all from the same year, and maybe some variation we are seeing is due to climate variation year to year. There were a couple “no flower” records during a typical flowering period and these might be either limited information from the sample, or perhaps something about that particular year. We are more than happy to share the raw data from this expedition with anyone who wants a closer look!
Leafcutter bees: building the perfect home
Many people have heard of leafcutter ants carrying bits of leaves around the forest like little parasols. Ants are all in the family Formicidae, in the order Hymenoptera, which includes bees, wasps, and ants. Leafcutter ants do not eat the leaves, but rather compost them to feed their fungus gardens. They only eat a particular species of fungus, removing all other species, and constantly tend their gardens to keep them clean.

Photo: Peter Oboyski
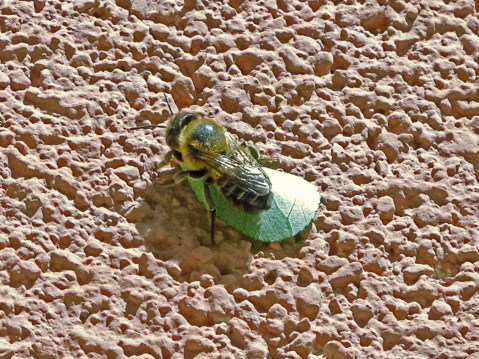
Photo: jacinta lluch valero https://flic.kr/p/ne1WHh

New Bombardier beetle expedition
Thanks to everyone who contributed to the Trechine Ground Beetles 2 expedition. With its completion, we have also finished off our remaining specimens from this ground beetle subfamily, and brought our total number of ground beetle specimens digitized to 4391. That’s a little less than 25% of the total number of specimens we had when we started this project back in July, 2016.
For our next expedition we’ll be focusing on the Bombardier beetles (subfamily Brachininae). The University of Alberta’s E.H. Strickland Entomological Museum has a large number of Bombardier beetle specimens, with 860 already digitized and publicly available from GBIF, and another ~4300 with images remaining to be transcribed as part of this effort. Most of these belong to just one genus, Brachinus, though there are about a dozen genera known in the subfamily. Bombardier beetles are found in temperate and subtropical regions around the world. They get their name from their ability to spray boiling hot chemicals from their abdomen, a characteristic whose mechanical/biological basis eluded explanation until a couple of years ago (a must see article and video here).
You’ll notice that our expedition image has changed from what use to be a photo of a specimen drawer to something a little more lively. We now feature an in situ photograph of a Brachinus specimen courtesy of PhD student and carabidologist, Wesley Hunting. Thanks Wes!
Make sure to check out our Bombardier beetle expedition!
Cheers,
–Bryan Brunet, PhD
Collections Management Advisor (Natural Sciences), University of Alberta Museums, Edmonton, Alberta, Canada
The Dentist who collected Fairyflies
 For those of you who have been helping us to transcribe the Chalcid specimen labels in Miniature Lives Magnified, you’ll have been coming across one particular style of slide label that always get us flipping our heads from side to side to read.
And almost all of those specimens seem to have been collected in Bournemouth, and the surrounding area.
Once you start seeing a few of these, you’ll start to notice that they are all marked ‘S.B.’ – who is in fact the Collector of these specimens.
I started to become curious about the mysterious S. B., and the hyper-local nature of his or her collecting, so I decided to do a bit of sleuthing with the help of our Curator Natalie.
“I do know about the Bournemouth man: he was a dentist, and originally a lepidopterist but worked a lot on Mymarids… “
So here’s what I’ve found out.
S.B. is Sidney Charles Scarsdale Brown – born in London in 1903, and passed away in Bournemouth, Dorset in 2003.
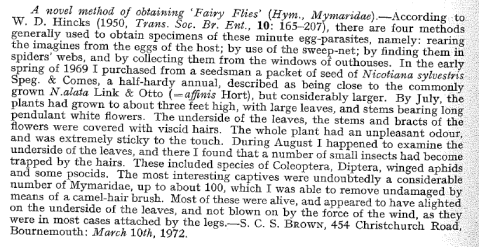
You will have noticed that many of his slides are also marked ‘Trap‘ (which is why we don’t see host insect & host plant information on these). Mr. Brown has written something about how he found these marvelous creatures in the following note in the Entomologist’s Monthly Magazine: 108: 94 (1973):
Mr Brown is mentioned on page 18 of The Conservation of Invertebrates report of the Monks Wood Experimental Station Symposium No 1, March 23rd – 25th, 1965:
“…a great deal of the information about the insect fauna of Scotland can be found in the diaries of a Mr. Harwood who lived in Aviemore just before the War…the diaries were now in the possession of Mr. Scarsdale Brown of Bournemouth, and on his death would be handed to the Hope Department, Oxford.”
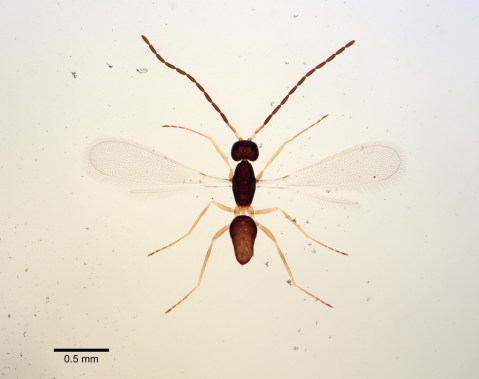
Mymaridae – Fairy Fly – Stephanodes elegans
He is also listed with all of his bona fides as S.C.S. Brown. F.D.S., L.D.S.. R.C.S., Vice President of the Bournemouth Natural Science Society, in their published proceedings from 1989 – 1990, which shares this wonderful background information about him:
“At the present time, the Society is very fortunate to have as a member Mr S.C. Scarsdale Brown. He joined the Society in 1937, was Chairman of Entomology 1939- 48.
After a few years away from the Society, he rejoined in 1967 and was – 44 – President 1975-76, the subject of his Presidential Address being “The Natural History of Bournemouth 1800-1900”. He edited the Proceedings from 1978-82 and is now an Honorary Member.
He has lived all his life in the Bournemouth area, working as a Dental Practitioner.
As a young man his interests centred on the Macrolepidoptera. He met W. Parkinson Curtis, who became a life-long friend, and joined the Society for British Entomology. There he met eminent entomologists such as Lt. Cdr. Fraser and William Fassnidge. The latter introduced him to the world of Microlepidoptera, at which he quickly became an expert, especially on the group of tiny moths known as Nepticulidae. Mr Brown was one of the contributors to the Illustrated Papers on British Microlepidoptera published in 1978 by the British Entomological and Natural History Society, his paper being illustrated with the superb paintings of Lt. Col. Fraser.
A meeting with Philip Harwood – one of the finest field entomologists – further added to his interests. Harwood concentrated on what are known to Lepidopterists as “Other Orders”, i.e. groups such as Coleoptera (beetles), Hemiptera (bugs) and Hymenoptera (bees and wasps).
Scarsdale Brown has studied all these groups, but has become one of the country’s leading specialists in Aculeate and Parasitic Hymenoptera. His meticulous and painstaking fieldwork is illustrated by his work on the group of Parasitic Hymenoptera known as Fairy Flies (family Mymaridae). This contains what must be some of the world’s smallest insects – one of the largest of the fairy flies has a wingspan of only 3mm; they pass their larval stages inside the eggs of other insects such as dragonflies.
During the course of his study, he has recorded 7 species of Mymaridae new to Britain.
His collection of specimens is a joy to behold – each fairy fly mounted in a microscope slide, and the tiny Nepticulid moths perfectly set. Mr Brown is an excellent artist in watercolour, and has contributed many notes to entomological magazines.
Over the years the members of the Society have heard some fascinating lectures from him on Hymenoptera and other groups. In 1988 he received an award in the Manse 1-P leydel 1 Prize Essay Competition.
In recent years he has suffered from failing eyesight, which has prevented any of the entomological study he loves, but he still attends some lectures of the Society, and maintains his own garden, where he specialises in growing camellias and lilies.”
We thought the timing was good for a phenology expedition
It’s tantalizing close to Spring here in North America, and some of you may have noticed hints of it, not just the nicer weather, but maybe moreso the first blooms of redbud, apple and plum and cherry trees, dogwoods, citrus. These harbingers of Spring have been part of not only the natural season cycle, but also human cultural history, for millennia.
People have been recording phenology for thousands of years. In Japan, records were kept of cherry blossoms back starting in 812AD. Yeah, not 1812, but 812. These have become part of national festivals around the world, with famous festivals in Tokyo and Washington DC. The date at which plants first flower, or have peak flowering, are often directly linked to climate conditions. The same is true of first appearance of new leaves, or new fruits. In Fall, leaf senescence, with first changes in leaf color, is also tied to temperature, as well as day length.
How do we know historical patterns of phenology? In some cases, we can refer to diaries and other written records, such as the case in historical record-keeping in Japan. In the last decade, we have a lot more tools at our disposal, including remote sensing – yes, imaging devices on satellites can tell when our planet gets more green! But for phenology records going back the last century, one powerful resource are natural history collections. A lot of the specimens collected and stored in museums tell us about phenology. But in order to use those data effectively for science, we need to actually report phenological stages and traits from those specimens. And that is where you come in!
Our newest expedition is a different beast than ones we have run in the past. In this expedition, you’ll help us determine if specimens from oak trees have flowers or fruits. These specimens already had their labels transcribed as part of an earlier expedition, and now we’ll annotate phenology information as well, and have that information associated with the specimen label data. These data can be used to look at historical patterns of phenology, and linked to past climate data records, to determine relationships, ultimately across many different species.
We are interested in your feedback on this first try at Notes from Nature with reporting phenology. In later expeditions, we may ask for more detailed information such as how many flowers are visible on a specimen, or fruits (in the case of oaks, we call the fruits “acorns”). For now, thanks for the help with enhancing the ability to use specimens for new kinds of science. We’ll share more about the science we are hoping to enable in later blog posts.
Finally, we are also launching our first mini-course with this expedition. This mini-course is about phenology, and how and why it is studied. What is a mini-course? Every 5 or so transcriptions, you’ll get some more information on phenology. We have 11 total “slides” in our mini-course, so you can see them all if you do 55 transcriptions. We haven’t tried a mini-course before, and we hope it proves interesting and not distracting. Let us know!
