
Visionary Violets
Spring ephemerals are nature’s reward for surviving winter. These springtime sweeties emerge during the transition from winter to spring. They are an indicator that spring is (finally) on its way. Spring ephemeral plants thrive under unusual conditions. They only have access to sunlight for a brief period of time – they get shaded out by tree leaves once spring is in full swing. The Southeastern United States is home to several species of spring ephemerals. Help us show appreciation for these phenomenal plants while supplementing our database of herbarium specimens.
In an effort to transcribe our spring ephemerals, we wanted to start with a beloved spring star. Violets are a staple spring ephemeral plant. Violets are edible, medicinal, and beautiful – what’s not to love? Their emerald green leaves bring color back to the landscape. Violet flowers – although commonly purple – can be other colors as well! Despite the fickle spring transition we’re having in the Southeast, we’re trying to stay inspired and excited for warmer weather! Remind yourself the winter will eventually end by helping us transcribe these valiant violets!
— Alexandra Touloupas, North Carolina State University
Almost there… a finishing challenge
We are running a new expedition finishing challenge, for those with completion anxiety (like we do). Here are the expeditions closest to finished, in near order of effort needed:
1. Butterfly_New World Swallowtail Butterflies II
Classifications: 433 / 609, 71% complete but only 175 or so transcriptions left.
2. Herbarium_Unlocking Northeastern Forests: Nature’s Laboratories for Global Chang
Classifications: 6,886 / 7,089, 97% complete (200+ left)
3. Herbarium_Amaranthaceae: Cosmopolitan Allrounder
Classifications: 981 / 1,332, 74% complete (~350 transcriptions left)
3. Herbarium_Natural North Carolina’s – Adoxaceae – Elderberry and Viburnum!
Classifications: 8,480 / 9,288, 91% complete (still 700 left)
We really appreciate the help, and we’ll report when these get finished, so you can see who wins the challenge!
New 5000 badge!
![]()
We have recently added a new herbarium badge. This brings our count of herbarium badges to 7. The new “mature grove” badge is earned after completing 5,000 transcriptions on herbarium expeditions. There is something special about this particular badge. It was created by our own longtime Notes from Nature volunteer Mr. Kevvy!
Thanks to Mr. Kevvy for the contribution and congratulations for reaching this milestone!
Another Swallowtail Butterfly Expedition!
It’s about time—the New World Swallowtail Butterfly project has another expedition up. This is the last batch of McGuire Center specimen images I am collecting for a study on the relationships between morphological variation and geography. This collection provides an excellent record of morphological variation across the distributions of these species.
You may also come across some specimens that look different from the other McGuire Center specimens—their backgrounds are white foam with a white ruler for scale. These images were generously provided from the private collections of dedicated amateur lepidopterists. The specimens come from a hybrid zone between two species—Papilio canadensis, Canadian tiger swallowtail, and Papilio glaucus, Eastern tiger swallowtail. We are interested in understanding whether the hybrid species looks more or less like one of its parent species, an amalgamation of the two, or if it has begun to display morphological characteristics that are completely unique.
As with the previous Swallowtail expedition, remember that there are two images for each specimen—a front and a back. This is important, because in some cases, the labels in the image have different data written on each side. Thanks for your help, and look closely—some of these specimens provide a unique historical record of biodiversity that has since been lost!
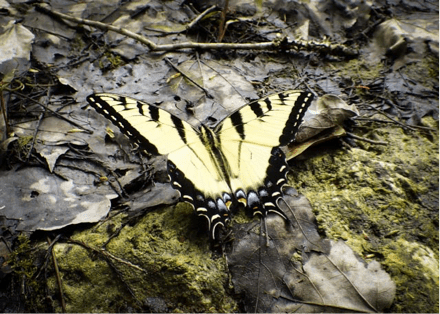
Photo: Hannah Owens
Check back when the expedition is complete—we’ll have some exciting preliminary data for you!
Hannah Owens, Post-doctoral Fellow, University of Florida
Fungus Among Us
Fungus Among Us considers the 19th-Century fungi collected in South Carolina by Henry William Ravenel
It’s not ‘your-celia’, it’s mycelia. Fungus Among Us asks volunteers to consider the myriad of mycelia that invade the earth, leaves, tree-bark and other substrates in their backyards. That’s exactly what Henry William Ravenel did back in the late 1840’s – except his backyard was either the malarial swamps of the lower Santee River or the diverse set of habitats found in and around Aiken, South Carolina. His exhaustive work culminated in the publication of the Fungi Caroliniani Exsiccati published between 1852-1856. The work consisted of five bound volumes called ‘Centuries’. Each Century contains 100 specimens of dried fungi that were painstakingly glued to the pages along with a descriptive label. In all, 30 copies of the five Centuries were produced for a grand total of 15,000 individual specimens that were carefully selected by Ravenel. Recognizing that his work was the first major effort to document the Fungi of North America since Lewis David von Schweinitz (1780-1834), Ravenel sent a copy to the Smithsonian Institution. Later that copy formed the nucleus of what is now the National Fungus Collection. The specimens presented here are from a copy that Ravenel presented to his Alma Mater – South Carolina College (now the University of South Carolina).
We encourage professionals, students, and citizen scientists from a variety of backgrounds (history, botany, mycology, etc.) to explore the world of 19th-Century Mycology and to help us by entering the label data visible on the image for each specimen. There is an interesting twist to this new expedition. Ravenel write his habitat information in latin. We don’t expect you to translate this text into to english, but some might find it interesting to research the meanings. Have FUN transcribing for . Among Us! Your hard work will eventually be displayed on the Mycology Collections data Portal, and will help update the entry for the Fungi Caroliniani Exsiccati.
To learn more about Henry William Ravenel and his contributions to science during the 19th Century please visit Plants & Planter.
So What Do We Do with All of Your Transcriptions?
We wanted to explain more about what happens behind the scenes after our awesome Notes from Nature volunteers do transcriptions or classifications. What do we do with it and how do we get it back to curators or other scientists at Museums? One thing you may not know is that every label is transcribed by three different people. The idea is that more folks examining labels will lead to better results. For example, if two people enter Wisconsin for the state, and one person accidentally enters Wyoming then we can assume Wisconsin is correct and that Wyoming was a mistake. We also know that some labels are tough to interpret, and sometimes a couple different guesses can get closer to the right answer than just one.
This seems pretty easy right? Well… it gets more complicated when we start working with free text labels. Those text boxes where you enter sentences and phrases from the label. Things like locality information “Route 46 next to a tree by the stop sign on 4th street”, or habitat data “in a field”. How do we compare answers for these kinds of labels. What do we do with extra punctuations? Extra spaces? Extra words? Different words?
We have spent the last few months writing code that helps handle these kinds of situations. Essentially we want to first find labels that match and if not then we want to select the best label we can from the set of answers. We have set up a series of decisions rules to go through your answers. First, we ask if two of the three answers are identical including spaces and punctuation. If they match we are done. If not, then we remove extra spaces and punctuation and ignore capitals and ask if two of the three answers are identical. If so then we select the one with the most characters- with the idea of getting more information.
These two labels would be found to match after removing punctuation, spaces and ignoring capitals. Here we generally take the one with more characters to include as much information as possible.
Rd. 10 KM 24
*RD. 10. KM 24
*this one gets selected more characters
At this next stage things get a little more complicated and we want to use our decision rules to select the best answer we can among the three. First we look for labels where all of the words from one are found in another – partial ratio match. If we find this then we take the label with the most words.
North Fork of Salmon River at Deep Creek, by US-93
*North Fork of the Salmon River at Deep Creek, by US-93
*partial match selection– more words
Finally, we compare the answers using both a ‘fuzzy matching’ scheme. The fuzzy matching looks partial matches on words for example someone may have written ‘rd’ whereas someone else wrote ‘road’, our fuzzy matching will allow those to be considered the same. This strategy also allows for slight misspellings between words. If we get a fuzzy match between the two labels then we take the label with the most words. That ensures that we get the most data we can from these answers.
*County Line Road 2 mi E of airport
County Line Rd. 2 mi. E. of airport
*fuzzy match select this one
The end result of all this is a reconciliation “toolkit”. We pass all transcripts from finished expeditions through this toolkit, and it delivers three products. The first is just the raw data. The second is a best guess transcription based on the field by field reconciliations described above. The third is perhaps the most important – a summary of what we did and how we did it as a .html file. The summary output is something we are extending, as we think of new things that providers might want to see. Here is an example from the New World Swallowtail Expedition, one of the more difficult expeditions we’ve launched.

More recently, we have added some new features, including information about how many transcriptions were done by transcribers (based on their login names at Zooniverse) and a plot of transcription “effort” and how that looks over all transcribers. The effort plot is very new, but we wanted to provide information on whether most of the effort is done by a very few people, or there is more even spread across transcribers. Here is an example for a different expedition, “WeDigFLPlants’ Laurels of Florida”:

Finally, we give them the information about how labels were reconciled (if there was an exact match, partial or fuzzy match). We do this so the providers can go through them and decide if there are some they want to check. We also highlight any problem record, those for which we could not get a match, or those for which there was only one answer – so we could not compare the answers. Here is an example from one label. The areas in green are the three different answers, the top row is the ‘best guess’ reconciled record and the gray row is information about how the reconciliation was done. For example on the first column Country all three answers were Myanmar – and in gray it says we had an exact match with three answers. The ones in red are potential issues (in this case only one answer given).

The goal of all of this is to make it easy for providers to use these data right away. And we’ll note that this tool allows us to also get an overall look at transcription “success” rates, something we may come back to future posts, because these numbers are striking and illustrate the high value of this effort.
– Julie Allen, Notes from Nature data scientist
Carabid beetle genome #seqthebeetle
This seemed fitting given our current bombardier beetle expedition. In addition, our very own CalBug data provider and NfN founder member Kip Will is a principal investigator on the project.

Help get a genome for the amazing Bombardier beetle #seqthebeetle
Vote daily from now until 5 April here https://tinyurl.com/gn84mu8
Phenology of Oaks: A recap
A huge shout out to our volunteers for quick work on our first NFN Ideas project, which focused on oak phenology. We completed the expedition a week after launching it, with 1944 transcripts of 644 subjects. 53 awesome transcribers took part. A lot of discussion on talk focused on some of the challenges with denoting flowers and fruits — it is harder than it first looks! So folks were interested in whether there was consistency among transcribers, and if the results would be consistent with an expert assessment. We have some initial answers to those questions and more! And a note that ALL of these data – the label data and phenological scoring – were ALL done by Notes from Nature volunteers.
So to get right to it! Transcriber consistency on this expedition was absolutely remarkable. Well above 99%. Yeah. We were surprised, too. There were three cases where we didn’t get consistent results. Just 3! Out of 664 subjects. So apparently there was very strong agreement.
We took a closer look at the three that seemed to prove difficult.
Those were:
- subject_id: 4308678 –http://www.sernecportal.org/portal/collections/individual/index.php?occid=11108535
- subject_id: 4308659 –http://www.sernecportal.org/portal/collections/individual/index.php?occid=11108069
- subject_id: 4308844 —http://www.sernecportal.org/portal/collections/individual/index.php?occid=11130030
The consensus scoring for those from transcribers were:
- subject_id: 4308678: Flowers: No, Fruits: No
- subject_id: 4308659: Flowers: No, Fruits: Yes
- subject_id: Flowers: Yes, Fruits: No
I then asked NFN’s own Michael Denslow, who is also a darn fine botanist, for his assessment (without reporting anything about transcriber’s scoring), and he was 100% consistent with the three above. He noted for 4308678, “Funky one for sure” and for 4308659, “The terminal buds might be confusing people on these. Based on the collection date (and presence of terminal buds) fruits could be from pervious fall.”
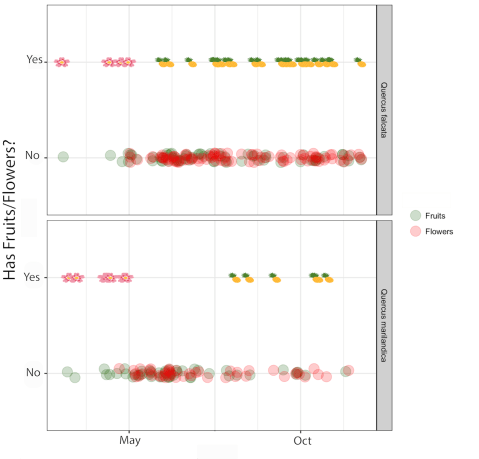
And finally, we wanted to see if we could use these data to look at phenology patterns, so our data scientist Julie Allen did some quick visualizations of the data using the statistical package, R, which has some great plotting functions. You can see our plot above, for two species, Quercus falcata (top) and Quercus marilandica (bottom), two common oaks where we had enough data to examine patterns. The plot shows time on x-axis measured from March through November, and the y-axis is just a yes-no response. For yesses, we show a little emoji, and for no’s you can see those no reports over time for fruits and flowers in different colors. Yup, we decided to go with a tropical flower and fruit motif here, despite oaks definitively not producing pineapples!
The really neat thing is that we do pick up the short, and early flowering period for oaks during Spring, and in Q. falcata, a seemingly quick transition to acorns, and a slower cadence for Q. marilandica (note the longer period between flowering and appearance of acorns). There are still some great questions to examine here — these records were not all from the same year, and maybe some variation we are seeing is due to climate variation year to year. There were a couple “no flower” records during a typical flowering period and these might be either limited information from the sample, or perhaps something about that particular year. We are more than happy to share the raw data from this expedition with anyone who wants a closer look!
Leafcutter bees: building the perfect home
Many people have heard of leafcutter ants carrying bits of leaves around the forest like little parasols. Ants are all in the family Formicidae, in the order Hymenoptera, which includes bees, wasps, and ants. Leafcutter ants do not eat the leaves, but rather compost them to feed their fungus gardens. They only eat a particular species of fungus, removing all other species, and constantly tend their gardens to keep them clean.

Photo: Peter Oboyski
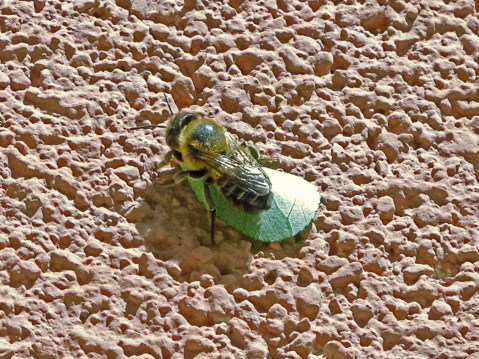
Photo: jacinta lluch valero https://flic.kr/p/ne1WHh

